Making JavaScript run fast on WebAssembly
JavaScript in the browser runs many times faster than it did two decades ago. And that happened because the browser vendors spent that time working on intensive performance optimizations.
Today, we’re starting work on optimizing JavaScript performance for entirely different environments, where different rules apply. And this is possible because of WebAssembly.
We should be clear here—if you’re running JavaScript in the browser, it still makes the most sense to simply deploy JS. The JS engines within the browsers are highly tuned to run the JS that gets shipped to them.
But what if you’re running JavaScript in a Serverless function? Or if you want to run JavaScript in an environment that doesn’t allow general just-in-time compilation, like iOS or gaming consoles?
For those use cases, you’ll want to pay attention to this new wave of JS optimization. And this work can also serve as a model for other runtimes—such as Python, Ruby, and Lua—that want to run fast in these environments, too.
But before we explore how to make this approach run fast, we need to look at how it works at a basic level.
How does this work?
Whenever you’re running JavaScript, the JS source code needs to be executed one way or another as machine code. This is done by the JS engine using a variety of techniques such as interpreters and JIT compilers. (See A crash course in just-in-time (JIT) compilers for more details.)

But what if your target platform doesn’t have a JS engine? Then you need to deploy a JS engine along with your code.
In order to do this, we deploy the JS engine as a WebAssembly module, which makes it portable across different kinds of machine architectures. And with WASI, we can make it portable across different operating systems, too.
This means the whole JS environment is bundled up into this WebAssembly instance. Once you deploy it, all you need to do is feed in the JS code, and it will run that code.
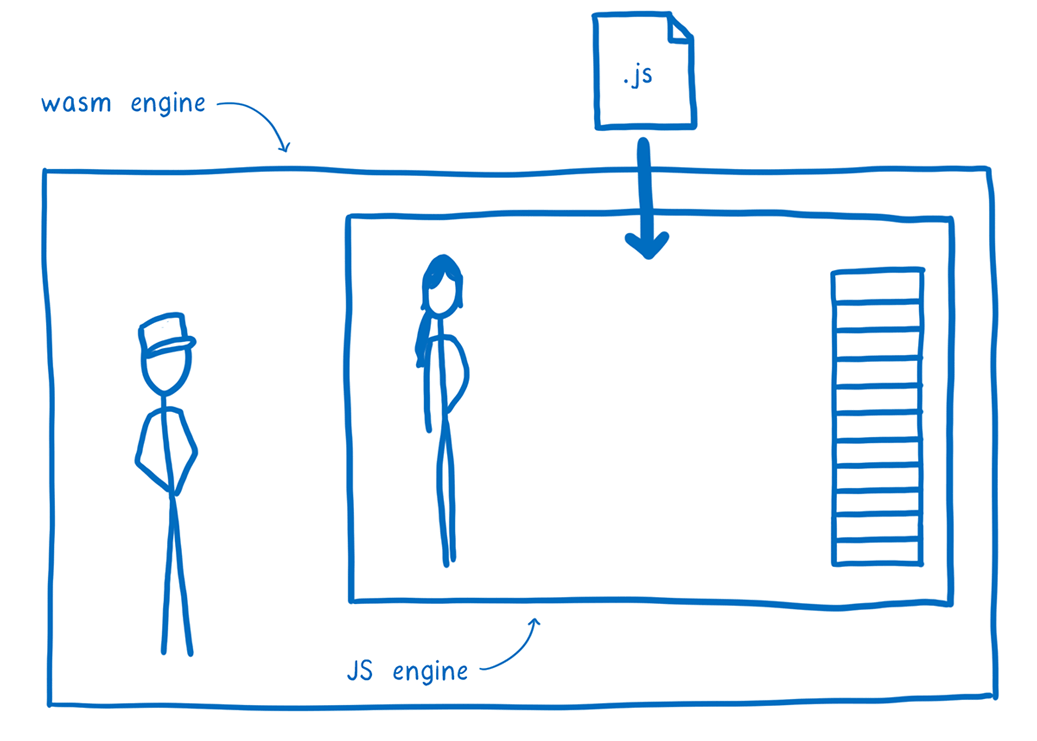
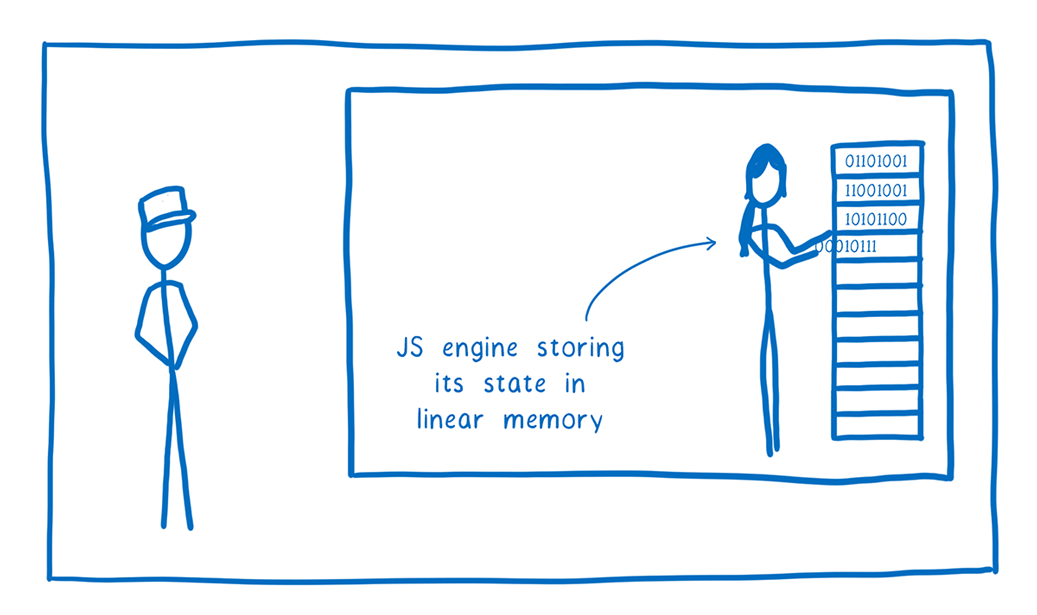
Instead of working directly on the machine’s memory, the JS engine puts everything—from bytecode to the GCed objects that the bytecode is manipulating—in the Wasm module’s linear memory.
For our JS engine, we went with SpiderMonkey, which is used in Firefox. It is one of the industrial strength JavaScript VMs, battle-tested in the browser. This kind of battletesting and investment in security is important when you’re running untrusted code, or code that processes untrusted input.
SpiderMonkey also uses a technique called precise stack scanning, which is important for some of the optimizations I explain below. And it also has a highly approachable codebase, which is important since BA members from 3 different organizations—Fastly, Mozilla, and Igalia—are collaborating on this.
So far, there’s nothing revolutionary about the approach I’ve described. People have already been running JS with WebAssembly like this for years.
The problem is that it’s slow. WebAssembly doesn’t allow you to dynamically generate new machine code and run it from within pure Wasm code. This means you can’t use the JIT. You can only use the interpreter.
Given this constraint, you might be asking…
But why would you do this?
Since JITs are how the browsers made JS run fast (and since you can’t JIT compile inside of a WebAssembly module) it may seem counterintuitive to do this.

But what if, even despite this, we could make the JS run fast?
Let’s look at a couple of use cases where a fast version of this approach could be really useful.
Running JS on iOS (and other JIT-restricted environments)
There are some places where you can’t use a JIT due to security concerns—for example, unprivileged iOS apps and some smart TVs and gaming consoles.

On these platforms, you have to use an interpreter. But the kinds of applications you run on these platforms are long-running, and they require a lot of code… and those are exactly the kinds of conditions where historically you wouldn’t want to use an interpreter, because of how much it slows down execution.
If we can make our approach fast, then these developers could use JavaScript on JIT-less platforms without taking a massive performance hit.
Instantaneous cold start for Serverless
There are other places where JITs aren’t an issue, but where start-up time is the problem, like in Serverless functions. This is the cold-start latency problem that you may have heard of.

Even if you’re using the most paired-down JS environment—an isolate that just starts up a bare JS engine—you’re looking at ~5 milliseconds of startup latency at minimum. This doesn’t even include the time it takes to initialize the application.
There are some ways to hide this startup latency for an incoming request. But it’s getting harder to hide this as connection times are being optimized in the network layer, in proposals such as QUIC. It’s also harder to hide this when you’re doing things like chaining multiple Serverless functions together.
Platforms that use these techniques to hide latency also often reuse instances between requests. In some cases, this means global state can be observed between different requests, which is a security hazard.
Because of this cold-start problem, developers often don’t follow best practices. They stuff a lot of functions into one Serverless deployment. This results in another security issue—a larger blast radius. If one part of that Serverless deployment is exploited, the attacker has access to everything in that deployment.

But if we can get JS start-up times low enough in these contexts, then we wouldn’t need to hide start-up times with any tricks. We could just start up an instance in microseconds.
With this, we can provide a new instance on each request, which means there’s no state lying around between requests.
And because the instances are so lightweight, developers could feel free to break up their code into fine-grained pieces, bringing the blast radius to a minimum for any single piece of the code.

And there’s another security benefit to this approach. Beyond just being lightweight and making it possible to have finer-grained isolation, the security boundary a Wasm engine provides is more dependable.
Because the JS engines used to create isolates are large codebases, containing lots of low-level code doing ultra-complicated optimizations, it’s easy for bugs to be introduced that allow attackers to escape the VM and get access to the system the VM is running on. This is why browsers like Chrome and Firefox go to great lengths to ensure that sites run in fully separated processes.
In contrast, Wasm engines require much less code, so they are easier to audit, and many of them are being written in Rust, a memory-safe language. And the memory isolation of native binaries generated from a WebAssembly module can be verified.
By running the JS engine inside of a Wasm engine, we have this outer, more secure sandbox boundary as another line of defense.
So for these use cases, there’s a big benefit to making JS on Wasm fast. But how can we do that?
In order to answer that question, we need to understand where the JS engine spends its time.
Two places a JS engine spends its time
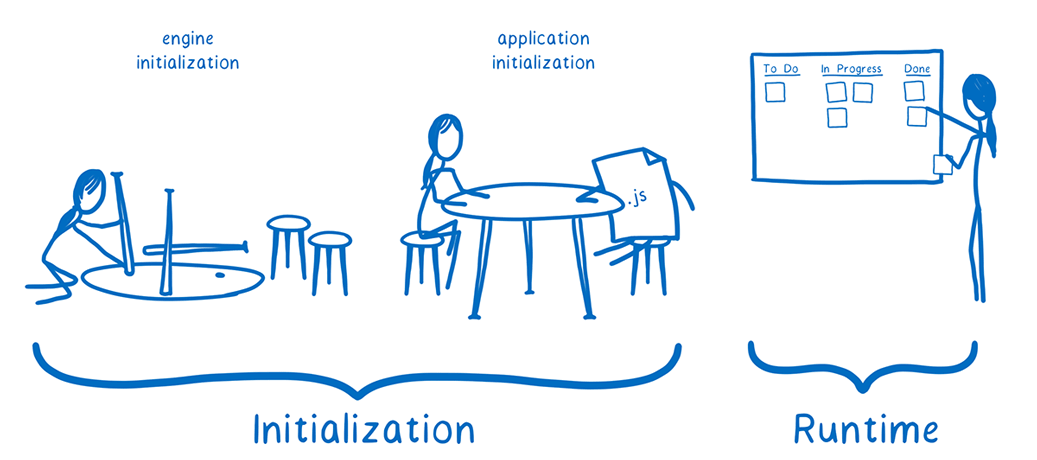
We can break down the work that a JS engine does into roughly two parts: initialization and runtime.
I think of the JS engine as a contractor. This contractor is retained to complete a job—running the JS code and getting to a result.

Initialization phase
Before this contractor can actually start running the project, it needs to do a bit of preliminary work. The initialization phase includes everything that only needs to happen once, at the beginning of execution.
Application initialization
For any project, the contractor needs to take a look at the work that the client wants it to do, and then set up the resources needed to complete that task.
For example, the contractor reads through the project briefing and other supporting documents and turns them into something that it can work with, e.g. setting up a project management system with all of the documents stored and organized.

In the case of the JS engine, this work looks more like reading through the top-level of the source code and parsing functions into bytecode, allocating memory for variables that are declared, and setting values where they are already defined.
Engine initialization
In certain contexts, like Serverless, there’s another part to initialization which happens before each application initialization.
This is engine initialization. The JS engine itself needs to be started up in the first place, and built-in functions need to be added to the environment.
I think of this like setting up the office itself—doing things like assembling IKEA chairs and tables—before starting the work.

This can take considerable time, and is part of what can make cold start such an issue for Serverless use cases.
Runtime phase
Once the initialization phase is done, the JS engine can start the work of running the code.

The speed of this part of the work is called throughput, and this throughput is affected by lots of different variables. For example:
- which language features are used
- whether the code behaves predictably from the JS engine’s point of view
- what sort of data structures are used
- whether the code runs long enough to benefit from the JS engine’s optimizing compiler
So these are the two phases where the JS engine spends its time.
How can we make the work in these two phases go faster?
Drastically reducing initialization time
We started with making initialization fast with a tool called Wizer. I’m going to explain how, but for those who are impatient, here’s the speed up we see when running a very simple JS app.
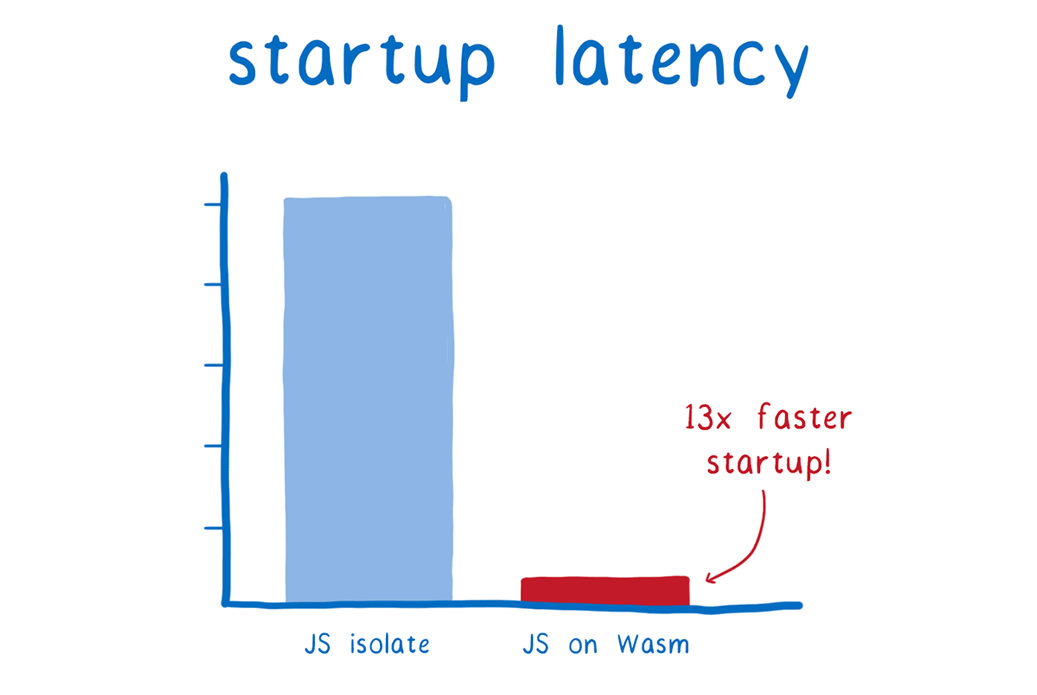
When running this small application with Wizer, it only takes .36 milliseconds (or 360 microseconds). This is more than 13 times faster than what we’d expect with the JS isolate approach.
We get this fast start-up using something called a snapshot. Nick Fitzgerald explained all this in more detail in his WebAssembly Summit talk about Wizer.
So how does this work? Before the code is deployed, as part of a build step, we run the JS code using the JS engine to the end of initialization.
At this point, the JS engine has parsed all of the JS and turned it into bytecode, which the JS engine module stores in the linear memory. The engine also does a lot of memory allocation and initialization in this phase.
Because this linear memory is so self-contained, once all of the values have been filled in, we can just take the memory and attach it as a data section to a Wasm module.
When the JS engine module is instantiated, it has access to all of the data in the data section. Whenever the engine needs a bit of that memory, it can copy the section (or rather, the memory page) that it needs into its own linear memory. With this, the JS engine doesn’t have to do any setup when it starts up. All of the pre-initialized values are ready and waiting for it.

Currently, we attach this data section to the same module as the JS engine. But in the future, once module linking is in place, we’ll be able to ship the data section as a separate module, allowing the JS engine module to be reused by many different JS applications.
This provides a really clean separation.
The JS engine module only contains the code for the engine. That means that once it’s compiled, that code can be effectively cached and reused between lots of different instances.
On the other hand, the application-specific module contains no Wasm code. It only contains the linear memory, which in turn contains the JS bytecode, along with the rest of the JS engine state that was initialized. This makes it really easy to move this memory around and send it wherever it needs to go.
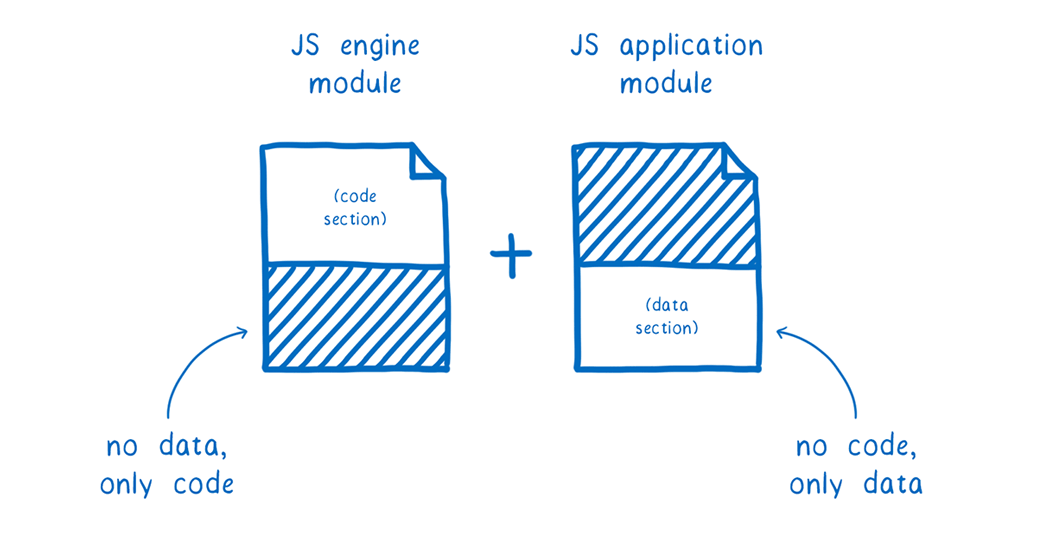
It’s kind of like the JS engine contractor doesn’t need to even have an office set up at all. It just gets a travel case shipped to it. That travel case has the whole office, with everything in it, all setup and ready for the JS engine to get to work.

And the coolest thing about this is that it isn’t JS dependent—it’s just using an existing property of WebAssembly. So you could use this same technique with Python, Ruby, Lua, or other runtimes, too.
Next step: Improving throughput
So with this approach we can get to super fast startup times. But what about throughput?
For some use cases, the throughput is actually not too bad. If you have a very short running piece of JavaScript, it wouldn’t go through the JIT anyway—it would stay in the interpreter the whole time. So in that case, the throughput would be about the same as in the browser, and finished before a traditional JS engine would have finished initialization.
But for longer running JS, it doesn’t take all that long before the JIT starts kicking in. And once this happens, the throughput difference starts to become obvious.
As I said above, it’s not possible to JIT compile code within pure WebAssembly at the moment. But it turns out that we can apply some of the thinking that comes with JITs to an ahead-of-time compilation model.
Fast AOT-compiled JS (without profiling)
One optimization technique that JITs use is inline caching. With inline caching, the JIT creates a linked list of stubs containing fast machine code paths for all the ways a bit of JS bytecode has been run in the past. (See A crash course in just-in-time (JIT) compilers for more details.)

The reason you need a list is because of the dynamic types in JS. Every time the line of code uses a different type, you need to generate a new stub and add it to the list. But if you’ve run into this type before, then you can just use the stub that was already generated for it.
Because inline caches (ICs) are commonly used in JITs, people think of them being very dynamic and specific to each program. But it turns out that they can be applied in an AOT context, too.
Even before we see the JS code, we already know a lot of the IC stubs that we’re going to need to generate. That’s because there are some patterns in JS that get used a lot.
A good example of this is accessing properties on objects. That happens a lot in JS code, and it can be sped up by using an IC stub. For objects that have a certain “shape” or “hidden class” (that is, properties laid out in the same way), when you get a particular property from those object, that property will always be at the same offset.
Traditionally, this kind of IC stub in the JIT would hardcode two values: the pointer to the shape and the offset of the property. And that requires information that we don’t have ahead-of-time. But what we can do is parameterize the IC stub. We can treat the shape and the property offset as variables that get passed in to the stub.
This way, we can create a single stub that loads values from memory, and then use that same stub code everywhere. We can bake all of the stubs for these common patterns into the AOT compiled module, regardless of what the JS code actually does. Even in a browser setting, this IC sharing is beneficial since it lets the JS engine generate less machine code, improving startup time and instruction-cache locality.
But for our use cases, it’s especially important. It means that we can bake all of the stubs for these common patterns into the AOT compiled module, regardless of what the JS code actually does.
We discovered that with just a few kilobytes of IC stubs, we can cover the vast majority of all JS code. For example, with 2 KB of IC stubs, we can cover 95% of JS in the Google Octane benchmark. And from preliminary tests, this percentage seems to hold for general web browsing as well.
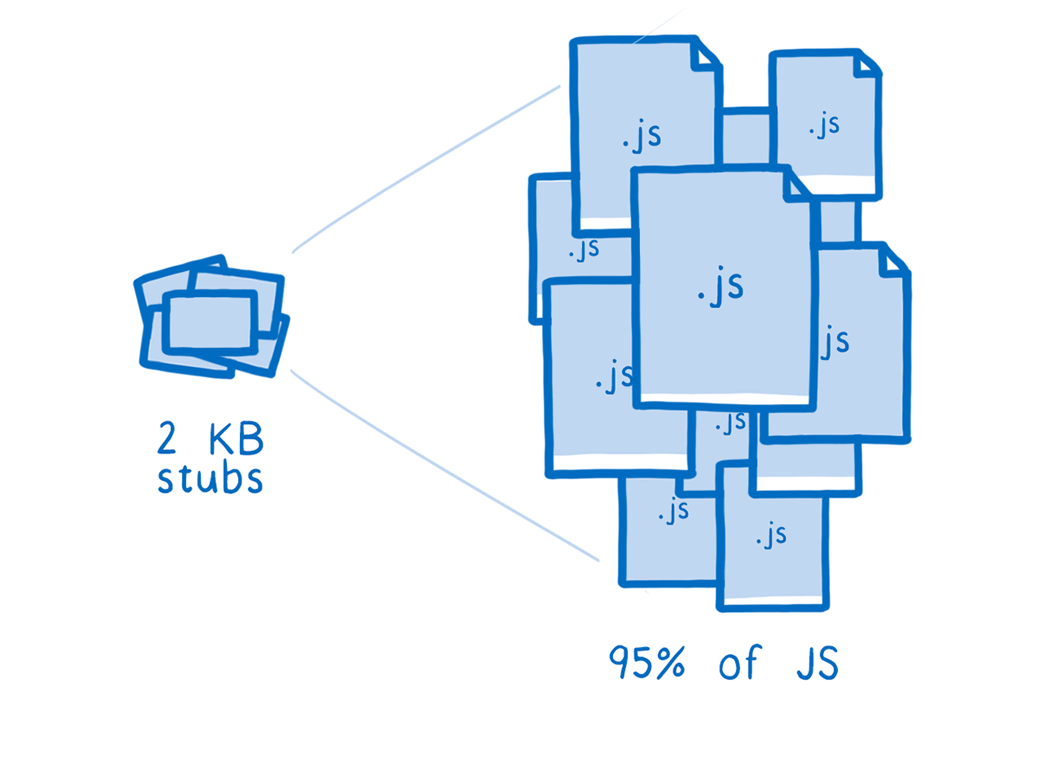
So using this kind of optimization, we should be able to reach throughput that’s on par with early JITs. Once we’ve completed that work, we’ll add more fine-grained optimizations and polish up the performance, just as the browsers’ JS engine teams did with their early JITs.
A next, next step: maybe add a little profiling?
That’s what we can do ahead-of-time, without knowing what a program does and what types flow through it.
But what if we had access to the same kind of profiling information that a JIT has? Then we could fully optimize the code.
There’s a problem here though—developers often have a hard time profiling their own code. It’s hard to come up with representative sample workloads. So we aren’t sure whether we could get good profiling data.
If we can figure out a way to put good tools in place for profiling, though, then there’s a chance we could actually make the JS run almost as fast as today’s JITs (and without the warm-up time!)
How to get started today
We’re excited about this new approach and are looking forward to seeing how far we can push it. We’re also excited to see other dynamically-typed languages come to WebAssembly in this way.
So here are a few ways to get started today, and if you have any questions, you can ask in Zulip.
For other platforms that want to support JS
To run JS in your own platform, you need to embed a WebAssembly engine that supports WASI. We’re using Wasmtime for that.
Then you need your JS engine. As part of this work, we’ve added full support to Mozilla’s build system for compiling SpiderMonkey to WASI. And Mozilla is about to add WASI builds for SpiderMonkey to the same CI setup that is used to build and test Firefox. This makes WASI a production quality target for SpiderMonkey and ensures that the WASI build continues working over time. This means that you can use SpiderMonkey in the same way that we have here.
Finally, you need users to bring their pre-initialized JS. To help with this, we’ve also open sourced Wizer, which you can integrate into a buildtool which produces the application-specific WebAssembly module that fills in the pre-initialized memory for the JS engine module.
For other languages that want to use this approach
If you’re part of a language community for a language like Python, Ruby, Lua, or others, you can build a version of this for your language, too.
First, you need to compile your runtime to WebAssembly, using WASI for system calls, as we did with SpiderMonkey. Then, to get the fast startup time with snapshotting, you can integrate Wizer into a buildtool to produce the memory snapshot, as described above.